Using the labeling interface
The labeling interface is what you see when you open a task in Label Studio.
The labeling interface is highly customizable, so the options that available to you depend on several factors:
- How the labeling interface has been configured and what kind of data you are labeling. This is the primary customization point and determines which tools are available and what you need to do to complete the task.
- How you have configured your labeling settings.
- Whether you are using an ML backend to assist.
- Whether you are using Label Studio Enterprise (the Enterprise version has additional customization options and the ability to leave comments).
- Whether you are labeling in quick view or the label stream.
Enterprise
The screenshots and videos below include a Comments panel. This is only available in Label Studio Enterprise.
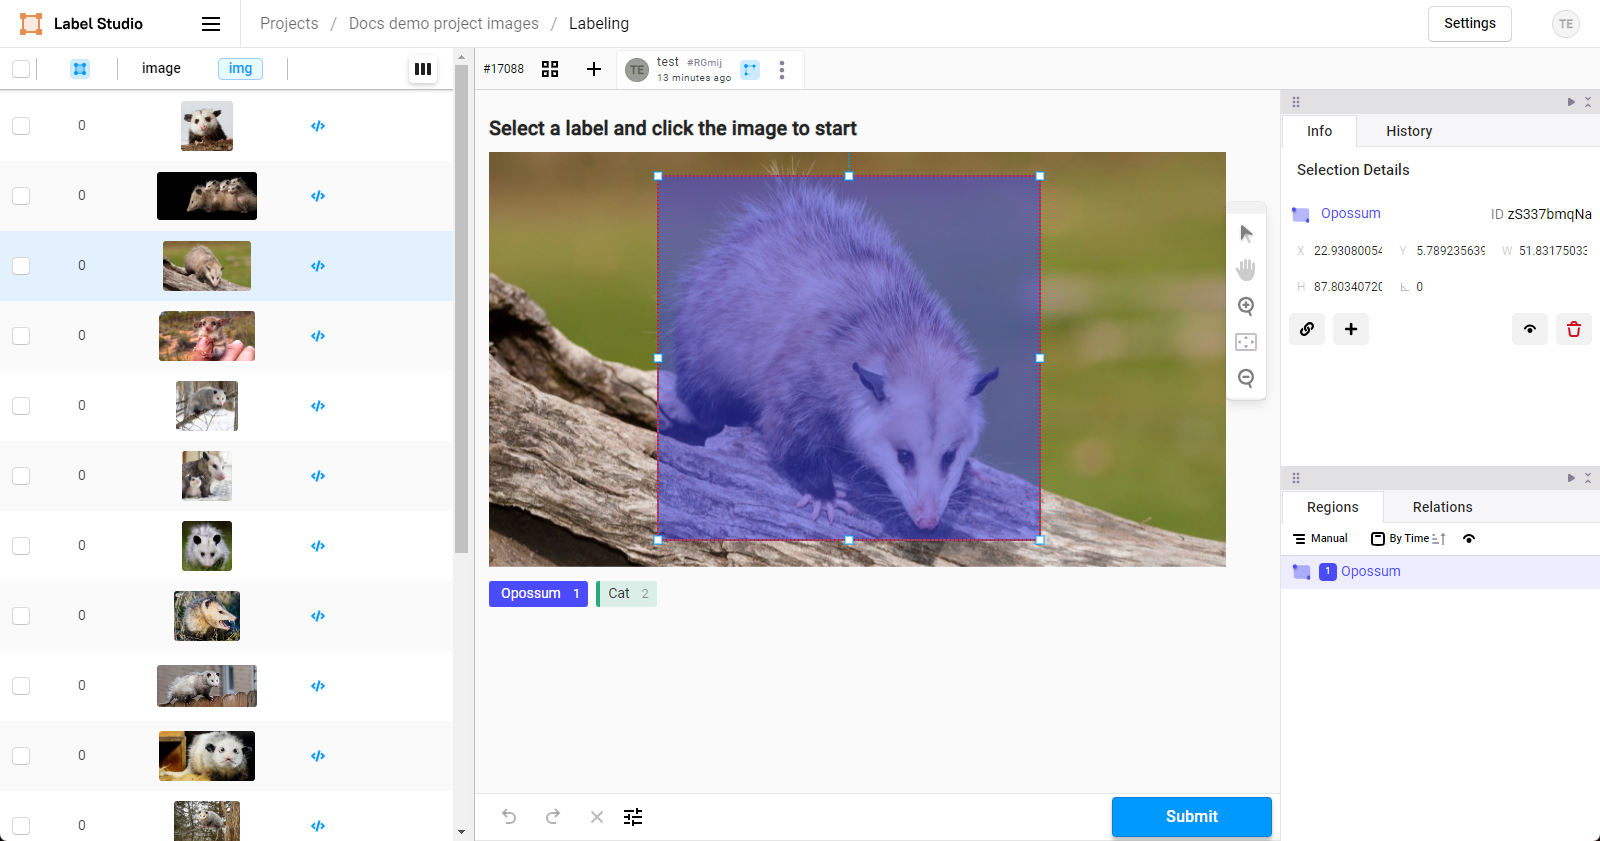
Quick view
The quick view is where you manually select each task from the Data Manager. There are fewer navigation controls from quick view, because if you want to skip or leave a task, you can simply click away to return to the Data Manager.
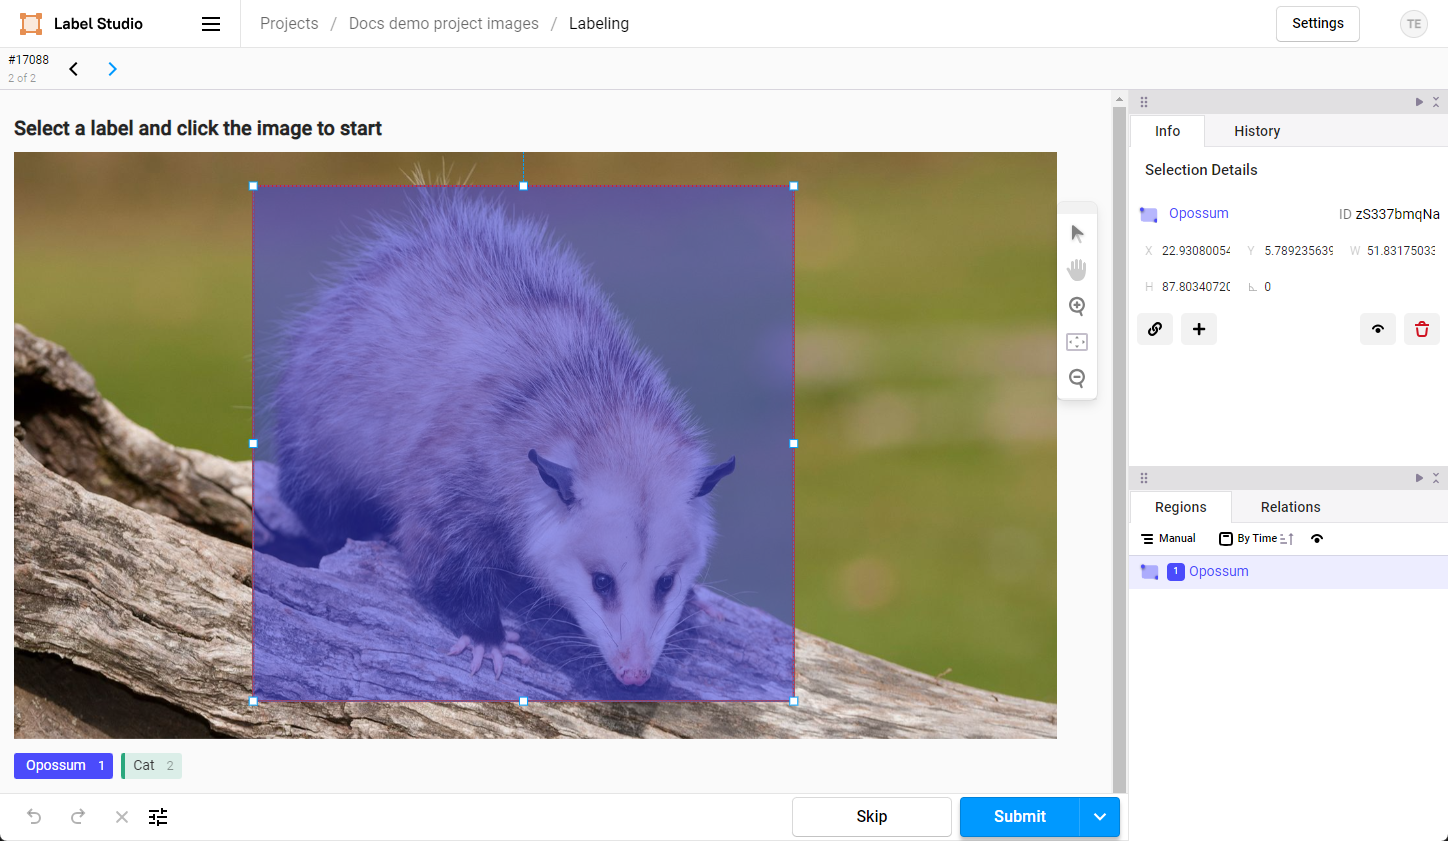
Label stream
In the label stream, as you finish each task, you automatically move on to the next one.
note
When labeling tasks, you should not open the label stream simultaneously in two tabs. This could result in you receiving the same task twice, which can circumvent project settings that address annotator overlap.
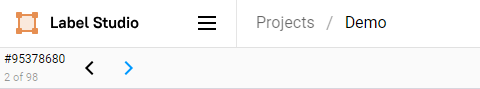
Navigating the label stream
You can use the arrows at the top to move through tasks.
| Action | Description |
|---|---|
| Blue forward arrow | Postpone the task. It is moved to the back of your labeling queue. |
| Black forward arrow | This appears above tasks you have already viewed or postponed. |
| Black reverse arrow | Move back through tasks you have already viewed. |
Skipping a task
The Skip action is only available from the labeling stream. Otherwise, you can “skip” a task by simply selecting another in the Data Manager.
When annotators skip a task, the task no longer appears in the labeling queue for that annotator. Other annotators still see the task in their labeling queue.
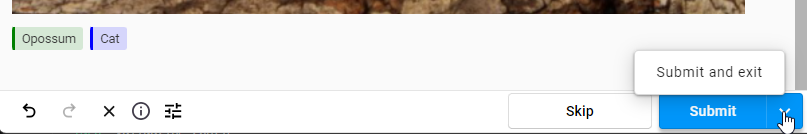
Exiting the labeling stream
If you are not finished but would like to exit the labeling stream (for example, to pause the lead time calculation), you can click the drop-down menu next to Submit and then select Submit and Exit (or Update and Exit). This will submit the current annotation and allow you to exit the labeling stream.
If you are not done with your annotation, you can simply check to make sure your draft was saved in the history panel and then navigate to the Projects page to stop the lead time calculation from running.
Label interface panels
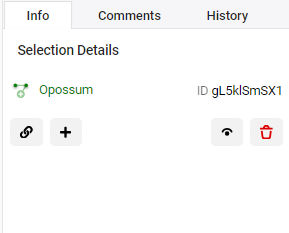
Info panel
This shows information about the selected regions.
If no regions are selected, the panel is blank. You can select a region by clicking on it in the display portion of the labeling interface, or by clicking a region under the Regions panel.
note
Not all annotation types will have information to display in the the Info panel. For example, a ranker task or a task in which you select a choice (but no regions) does not have additional information to display.
Tip
To select multiple regions, press Ctrl while selecting regions in the Regions panel.
| Action | Icon | Description |
|---|---|---|
|
Create relation between regions |
|
Click this to add a relation between two regions. After clicking this, select another region in the task display. A connection arrow appears between the two regions. For more information about regions, see the Regions panel below and Add relations between regions. |
|
Edit selected region meta |
|
Modify the metadata of a selected region within a task. Metadata can include additional information about the region, such as attributes, tags, or comments that provide context or classification details beyond the basic label. This action is useful for refining data annotations, correcting errors, or adding notes that can be used for machine learning model training or further data analysis. |
|
Show/hide |
|
Toggle this to show or hide the region in the display portion of the interface, without deleting or otherwise affecting the region. This is useful when you are trying to add multiple overlapping regions. |
|
Delete |
|
Delete the selected region. If you accidentally delete a region, press |
Use the Info panel to refine a region
For some region types, you can finely tune a region by editing its values.
For example, if you are adding a rectangle, you can modify its coordinates and rotation from the info panel:
History panel
This panel displays the annotation history as it progresses through the creation and review process.
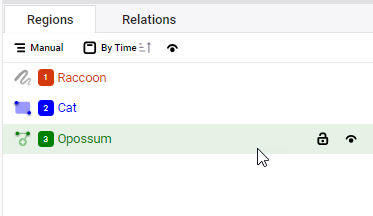
Regions panel
A region is an area within the data that you as identify as an annotator. For example, this can be a box that you draw on an image, a section of highlighted text, highlighted video segments, and so on.
Not all tasks require regions. Ranker tasks, classification tasks, or tasks in which you select an option from multiple choices do not require you to create regions. In those cases, the Regions panel is empty.
For information about adding regions, see Labeling regions.
Actions
- Select a region to display it in the Info panel.
- Click the lock icon to lock a region. You cannot modify the region until it is unlocked. For complex tasks with multiple regions, this can help prevent you from making unintentional changes.
- Click show/hide to control whether the region is visible in the display portion of the labeling interface. This can be useful when you are adding multiple overlapping regions.
- With a region selected, press
backspaceto delete the region.
Grouping
For complex annotation tasks in which you have multiple regions, you can use the grouping options to better manage the regions list.
- Group Manually–You can organize regions by dragging and dropping them within the regions panel. This is useful for grouping related regions together according to your specific needs.
- Group by Tool–If you are using different annotation tools, it might be helpful to group regions by the tools that you used.
- Group by Label–Group regions that have the same label.
note
If you are using predictions, you will also see an icon indicating which regions have been generated using a prediction.
Ordering
If you are using the Group Manually option, you can order regions as follows:
- Order by Time: Regions are ordered by when they were added. This is the default.
- Order by Score: If there is a scoring method present such as a confidence score or a quality rating, then the regions are ordered by score. These are typically only present if you are using an ML backend.
note
The order and grouping that you apply does not affect the underlying data and does not change how the annotations are exported. It is simply for your convenience when working in the labeling interface.
Relations panel
This panel lists any relations you have added between regions. For information on adding a relation, see Add relations between annotations.
A relation indicates a connection between two regions, such as a hierarchy or order. These are often added in NLP tasks.
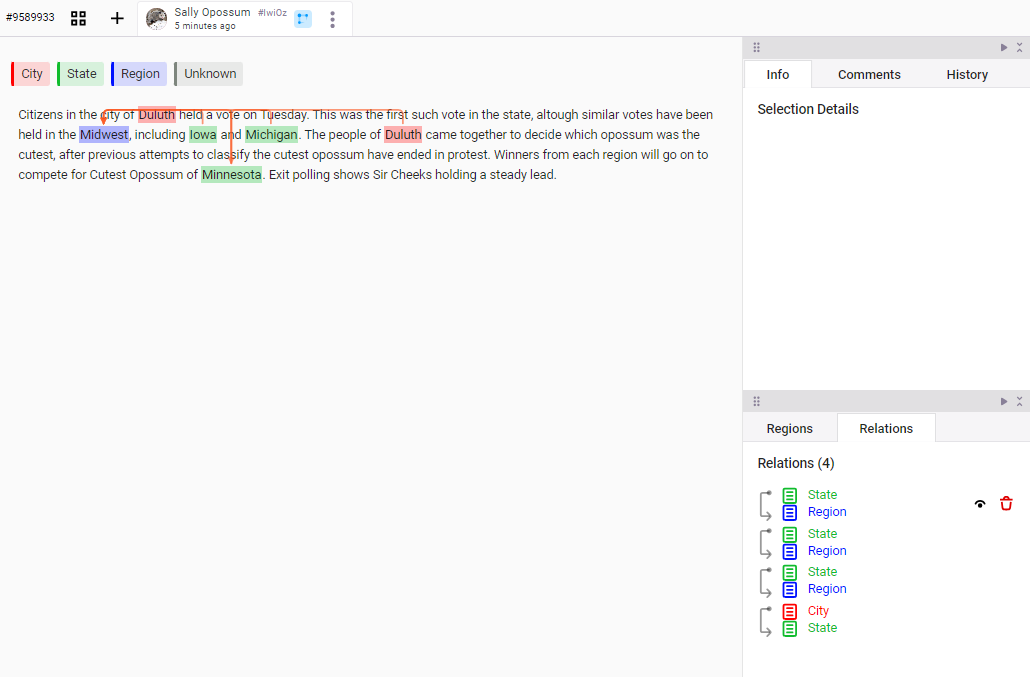
You can use the Relations panel to delete relations and hide relations. Click the arrows between the relations to change the direction. They can be unidirectional or bidirectional arrows.
Customize your layout
As an annotator, there are several things you can do to customize your layout:
- Use the settings to determine whether the available hotkeys are displayed.
- Customize your panel layout:
- Click the arrows to collapse/expand panel groups or the entire side pane.
- Drag and drop the panel tab title to reorder panels within the side pane.
- Use drag and drop for a panel group to undock them from the side and move them around your screen.